
This is the simplest way I can summarize the concept of Market Noise
The original concept of confirmation for an entry was close above the line denoting the boundary of sentiment (Support / Resistance).
This was problematic because there was no real structure for increasing probability of success with this, as the price may close just past the boundary, giving an early entry or it may shoot through the boundary and drive a long way prior to closing, sometimes losing most of the potential profit from the transaction.
Then observant people observed that there was a largely definable zone around the Trend Line / Momentum Line into where the majority of high / Low points which did not continue direction, reversed back against the original direction leaving High / Low turning points.
This observation led to much testing and defining and retesting ad Nauseum.
The conclusion was that you could make a defined zone around the Boundary Line whereby if the price action achieved this point – close or not – there was a high probability of continuation of price direction and on longer time frames this probability can be as high as 83%.
There were 3 schools of thought on how to determine the boundary of this zone:
- What the market tells you – using the average of the highs / lows around the Support / Resistance Boundary. Thus, the zone was somewhat guesswork based on observation of where the extremities were that didn’t reach the boundary and where they were as an average for the ones that penetrated the Boundaries. There is a lot of subjectivity with this method.
- Using a tool that is relevant to current price action to define an objective zone boundary and then the search for such a tool and defining its reliability began. There were numerous tools worked on for this and some worked well until the market changed conditions – such as all markets did in the debacle aftermath of the Housing crisis and its culmination in 2007. The most common toll that was settled was the Average True Range – ATR. This tool is applicable to every instrument and every time frame AND changing market conditions which is why it became the most popular tool for this exercise. There were other tools achieving similar result and they worked well right up until the Proverbial hit the fan.
- A slightly more conservative approach was the greater of – What the Market tells you or ATR, so in periods of big volatility the market tells concept may be more conservative
A major advantage of this zone is that you are able to place a Stop Order in the case of continuation or a limit order in the case of a bounce off Supp / Res. This means that you do not have to be there watching things all the time in order to enter as price reaches the level you want it to.
I was originally taught – what the market tells you – When you have an accurately placed Trend Line, you can see where price approaches the Trend Line and backs off and where price penetrates the Trend Line and backs off (false Break), and you then have your zone – aka – Market Noise.
The biggest problem with this is that you require a strong Trend Line to get accurate readings.
I personally changed from 1 of the other approaches of zone definition to ATR after the 2007 debacle as nothing else was adaptable enough to be accurate.
After much exhaustive testing I arrived at 0.5xATR (Average True Range) (13) for my Market Noise. I am often asked why ATR13 instead of ATR14, the answer to that is simple – the inventor of the ATR always used 14 periods and I don’t k now why, it is not quite 3 trading weeks on D1 – it is not quite 2.5 days on H4 it is just over ½ day on H1, and just seems to be an arbitrary figure.
13 is a Fibonacci number and therefore seemed to me to have more relevance to price action as such. Does it – I don’t know, just a personal feeling. Does it make any difference – practically, probably not.
ATR is specific to each instrument because all the calculation is based on that instrument`s price action and is therefore also Time Frame and volatility specific.
Does this concept also hold good around support and resistance and is it possible for you to show it on the chart?
You will see more and more people using Horizontal Support / Resistance zones now instead of a single line of support or resistance – that is, I believe a development of Market Noise around those areas.
You have to insert the lines manually, I do not know of a tool to do that
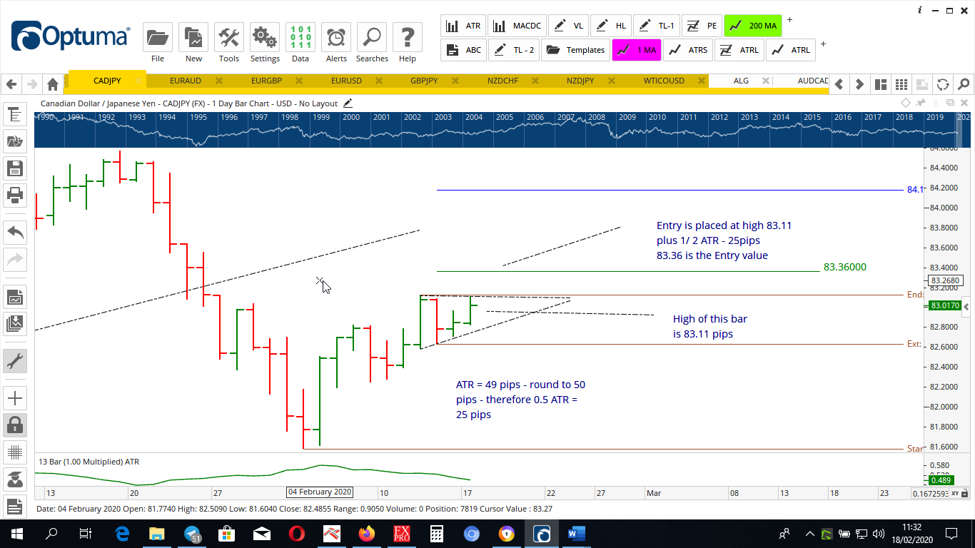
CADJPY Daily Chart
0.5 ATR(13) applied to a pattern to confirm entry to a pattern developing. Notice the zone from the upper momentum line of the pattern to the Entry value. If price penetrates the momentum line of the pattern, but does not achieve the entry value and then reverses – the entry order is cancelled.
(To enlarge the picture, download and zoom in).
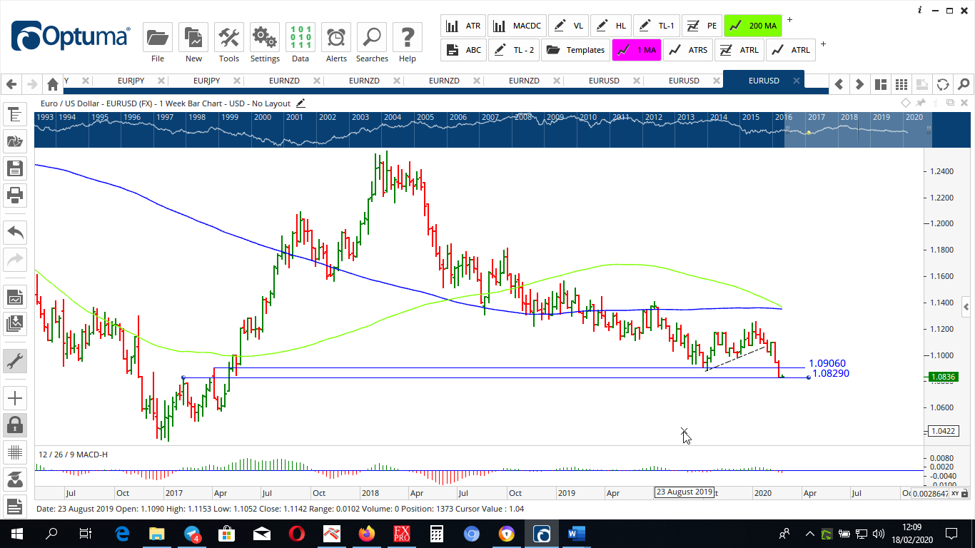
EURUSD Daily Chart
Example of Support Zone being used, which I believe is a development of Market Noise zones
Lacked your explanation of Market noise a lot of it is just sitting around and understanding consolidation. I was wondering about the RSI in the macd which are you today TDI indicator so thank you nice service
What do you think was lacking?
What do you mean RSI in MACD?
What is TDI Indicator?
VERY NEW YO ME, I’M LEARNING A LOT FROM THE MASTER.
H Makhuwane
I am happy that you have been able to take some benefits from this and other articles