
There is a lot written about trendlines and their application BUT most of it is generalisations about placement and meaning, which does nothing really to increase the probabilities of successful trades.
There is little out there which goes into the specifics and accuracy involved with Trend line placement for the purpose of increasing the probabilities of success.
Trendlines are basically, a visual representation of Resistance and Support, and for the basics of trading directional (Trend) changes there are 4 trendlines that are used:
Falling Resistance Line – Horizontal Resistance Line– Rising Support Line– Horizontal Support Line.
For Ranging (Channel) Markets there are 6 Trendlines that are used:
Falling Resistance Line- Rising Resistance Line- Rising Support Line – Falling Support Line – Horizontal Support Line – Horizontal Resistance Line
What is a Trendline?
Let us for a minute ask ourselves what Trendlines are and what they tell us?
We can consider Trendlines to be the boundaries of sentiment – Resistance can be thought of Boundary of Positive Sentiment and Support can be considered the Boundary of Negative Sentiment.
A boundary can also be considered as a ¨Fence Line¨ and as such, Trendlines can be considered as the ¨Fence Line¨ defining the limit of AND containing the price action of that run or trend.
When we come to this realisation, we also then need to consider how accurately these need to be drawn and the impact of the accuracy of their applications on a Traders Results.
Would you buy a Block of land where it was patently obvious that the fence line was defining the area of that piece of land that was included in the Contract of Sale – BUT – you could also clearly see that fence line was well inside the CLEARLY marked survey pegs which accurately define that piece of land as it was Surveyed?
You want that Contract to include ALL the land as it was surveyed for the sake of accuracy – would you not?
We want the full measure of the land as it was surveyed and marked out on the map and contained within the Title Deed?
With this in mind is there any good reason why we would not want our full measure of profits from trades because of and if accurate Trendline placement increases the probabilities of such events?
Would we not also want to increase our reliability and probabilities of successful trades from accurate placement?
Would we also not want to reduce the number of losses that ARE incurred through inaccurate Trendline Placement?
It is all very simple so far – BUT – this is where it becomes unsimple….
How we accurately define trendlines, is not complicated but it does take some practice and requires some specific rules which were drilled into me when I first started trading. These specifics really do make a large difference to the accuracy of trades and their reliability when looking for either:
Trend / Momentum Line Breaks
Trend / Momentum Line retests
How does this make a difference is a good question to ask?
The answer to this question is contained within the many charts which are posted online in many of the groups on the Telegram Platform. It is a worthy exercise to look closely at these charts in regard to Trend Line placement and see the many varied Trend lines which appear on the same chart by different people.
The biggest variations in Trend Line application appears to be with those who use candle charts rather than those who use Bar Charts, and I point out a couple of reasons in my article on Candle vs Bar Charts.
https://petervarcoe.com/candle-vs-bar-charts/
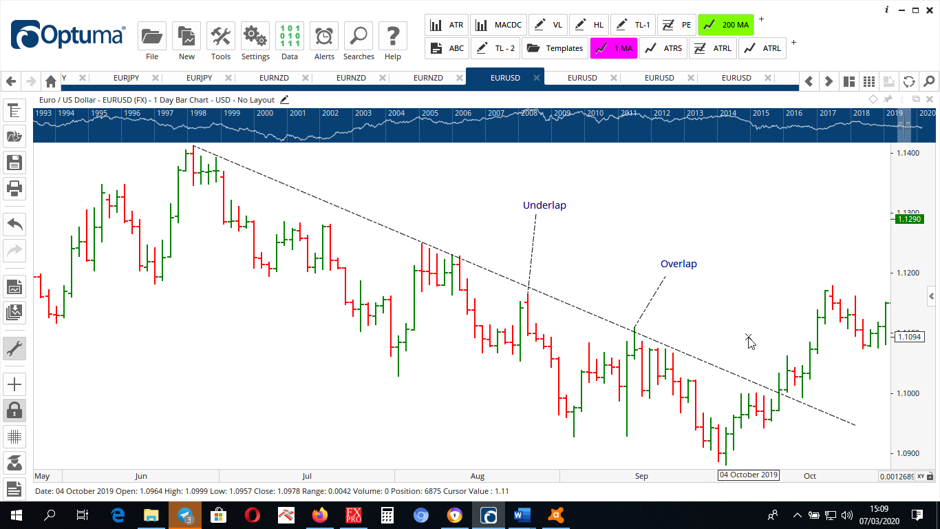
Some of these variations include many trendlines drawn to the body of the candle and not to the highs or lows of the candles – all this creates inaccuracies that will affect the reliabilities of entry and exit signals and therefore the probability of that trade being profitable or a loss.
This can be easily identified below where the blue line is drawn across the lows of the bodies and the black line is across the lows. This brings about a 16-pip variation in the Trendline value for the next candle.
My belief behind these inaccuracies is that people are not taught how to define accuracy in their application of Trendlines.
General Definitions of Trend Line Placement:
Place the Trend Line across a minimum of 3 High Turning Points or Low Turning Points
Place the Trend Line across 2 High Turning Points or Low Turning Points – ONLY IF the 2nd point is a ¨Major / Pivot¨ Turning Point
There are 2 major problems here:
Seldom do you get 3 Turning points that line up in a straight line, so a compromise needs to be found, which is where the concept of ¨A Line of Best Fit¨ comes in
What is the definition of what is called a Major or Pivot Turning Point?
A Line of Best Fit is where we start our trend line at the furthest Turning Point to define the current Trend, we then draw it through the next 2 or more points and we raise or lower it so that some of the turning points penetrate the line and some do not – the key is to get the underlap / overlap the same.
This is about as accurate as you can get using this method. It is not perfect, and I look at allowing an extra pip or 2, as a buffer for inaccuracy when calculating the value of the trend line for breakout.
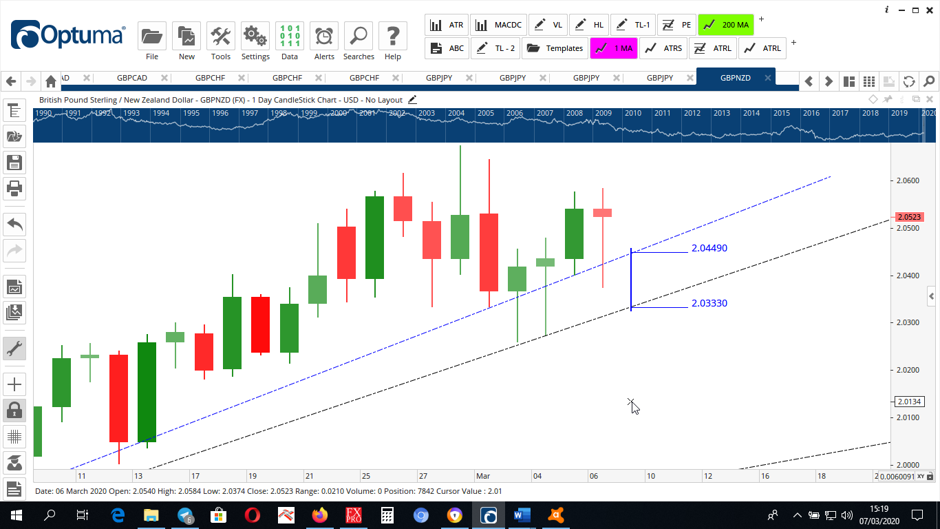
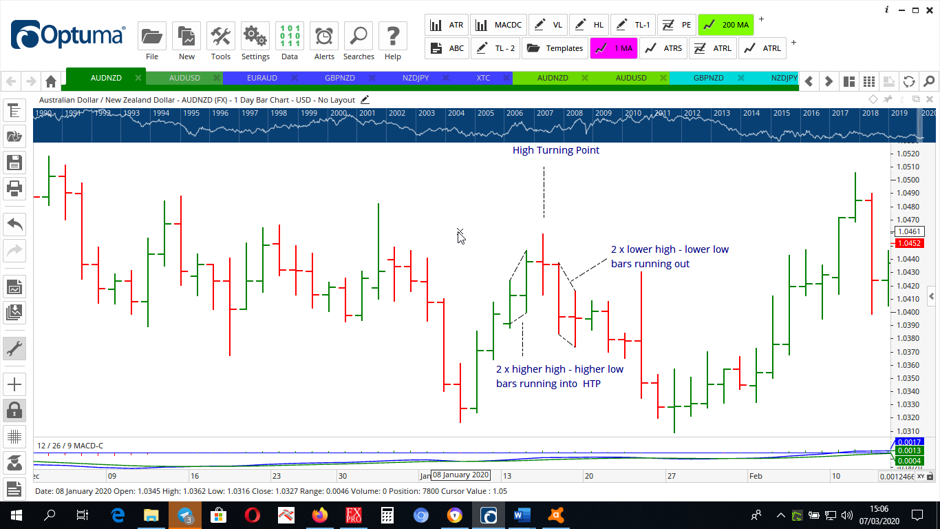
Major / Pivot Turning Points are determined by the price action immediately around them. For a High Major Turning Point – a High Turing point has 2 bars with higher highs and higher lows running into it and 2 lower highs and lower lows running out of it.
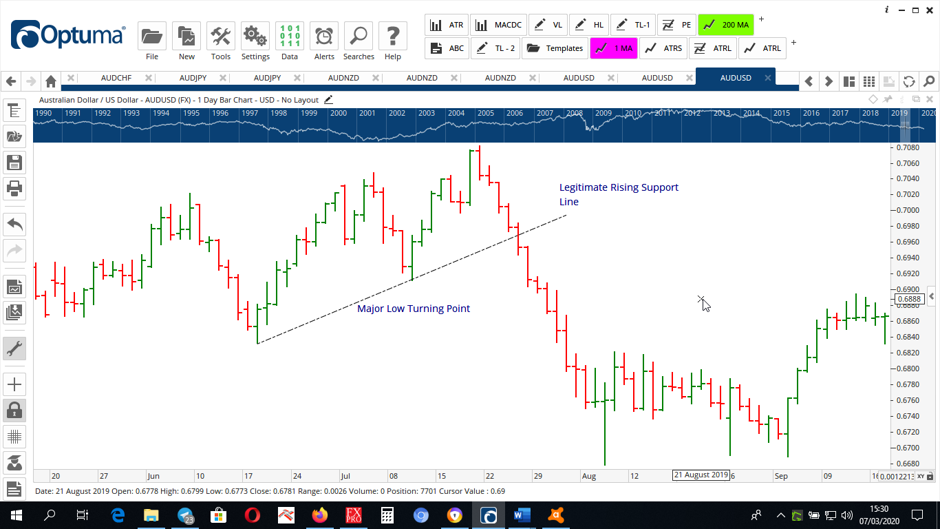
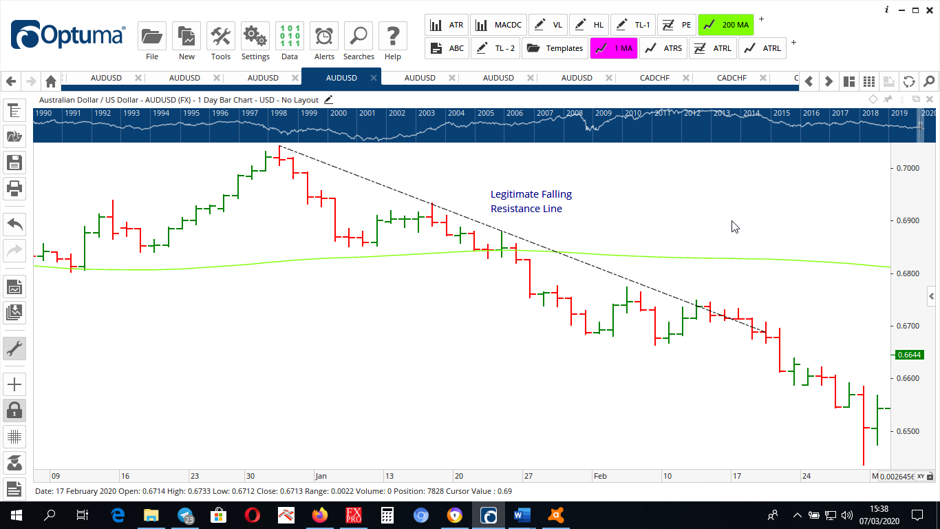
As we can see above, we have a legitimate 2 touch Trendline with the 2nd touch being a Major Low Turning Point.
Below we can see the difference between 2 definitions of Trend Lines including the often-used placement across the Bodies of candles and a Legitimately placed Trendline on the same chart as a Bar chart
There was enough Penetration of this application to trigger an entry, which would have been stopped out.
The same chart as a Bar chart with a legitimately placed Falling Resistance Line, there was insufficient penetration to trigger an entry and the Line was then repositioned and allowed a profitable entry.
The key here is that Correct application does assist in keeping you out of losing trades thereby reducing the number of losses sustained – which is as important as maximising the profits from successful trades.
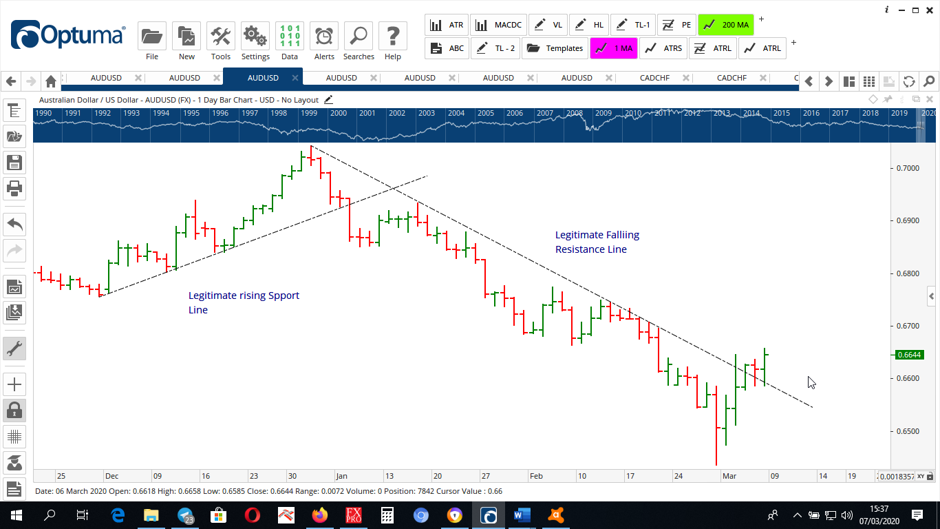
Here we can see the same chart – legitimately repositioned Falling Resistance Line, sufficient penetration of the correctly positioned Trend Line.
We have a confirmed entry of the Trend Line Break and a confirmed Ascending Pennant at time of publishing the article.
Momentum Lines
Momentum Lines essentially contain the price action inside consolidations and accurately placed Momentum Lines are an essential key in trading Flags, Triangles & Pennants.
There is a lot on this subject in my book on Trading patterns which can be seen via the link below.
Triangular Patterns depend on accurately placed Momentum lines for accuracy reasons – any triangular pattern breaking out at <50% pattern length or > 85% pattern length has a higher probability of failure than of success – its success rate is less than 50%.
Ideally triangular patterns should break between 60 – 85% of pattern length. Therefore accurate line placement is crucial for successful Pattern trading.
More can be seen on the subject in the most specific and detailed book on Pattern Trading Available:
https://petervarcoe.com/the-inside-secrets-of-elite-traders-patterns/
Conclusion
The accurate placement of Trendlines – as with accuracy in application of any technique – is a key role in successful trading. This is a skill which will assist you greatly in increasing your profitability while doing both – Maximising your number of profitable trades and reducing the number of losing trades which you undertake.
As I say to all my students – Please attempt to prove me wrong – you will learn more that way.
Great information. As always, Peter, every subject you choose to explain comes out very very clear. I cannot read more than a page of the Pattern book without scribbling a page of my own notes. Greatest book I have ever bought.
Thank you Ayienda, for your great feedback