
Overview
I get a lot of questions regarding the difference between High / low points and High / Low Turning Points in price action
High and low turning points are the point of turn from a direction of price action at the point of change and normally occur at the end of rallies and pullbacks but are frequent occurrences during the run of all trends.
A High Turning Point has a higher high and higher low than the bars / candles on either side of it
A Low Turning Point has a lower low and lower high than the bar / candles on either side of it
These points are just a natural part of price action and are nothing special.
The normal convention is that you need 3 High Turning Points or 3 Low Turning Points which can be connected in order to legitimately place a Trend Line.
Some examples below:

Here we see 7 High Turning Points in this downtrend for AUDUSD D1.
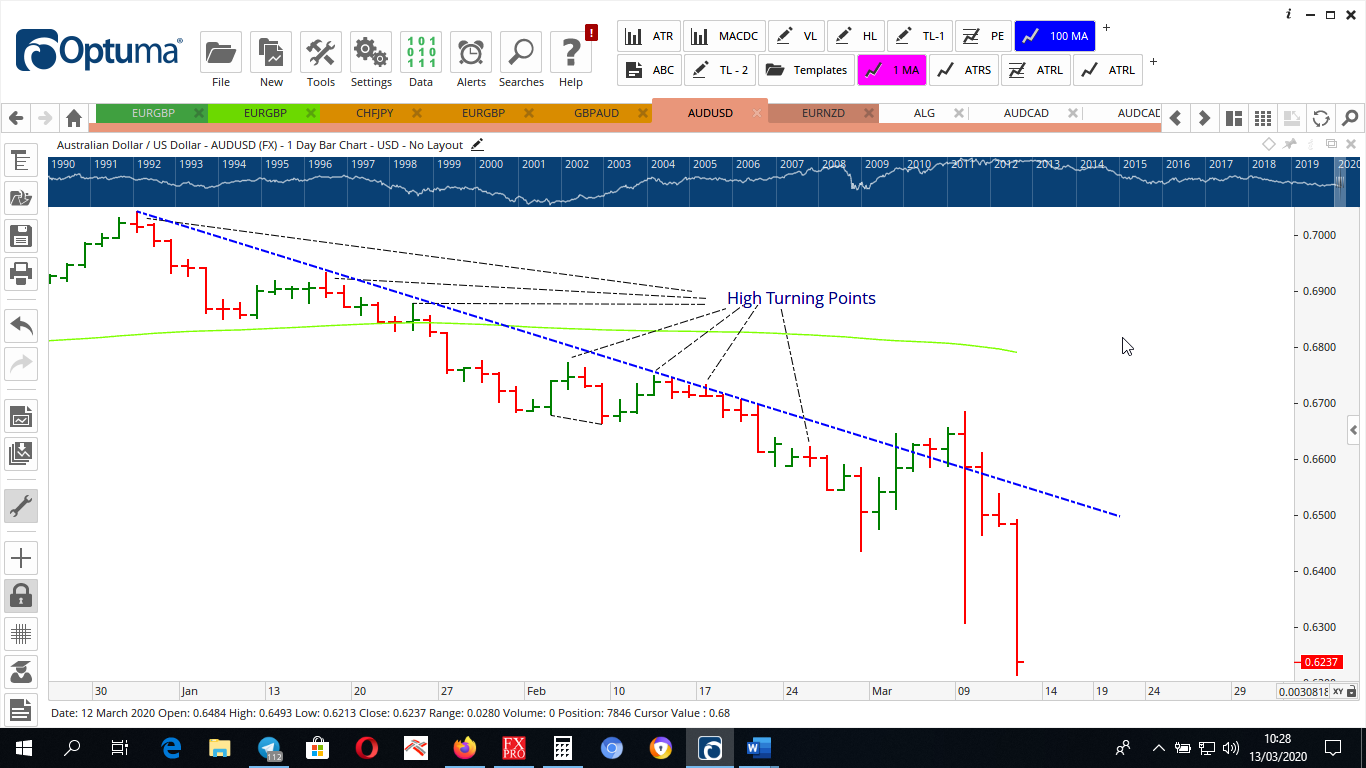
Falling Resistance Trend Line placed across 5 High Turning Points
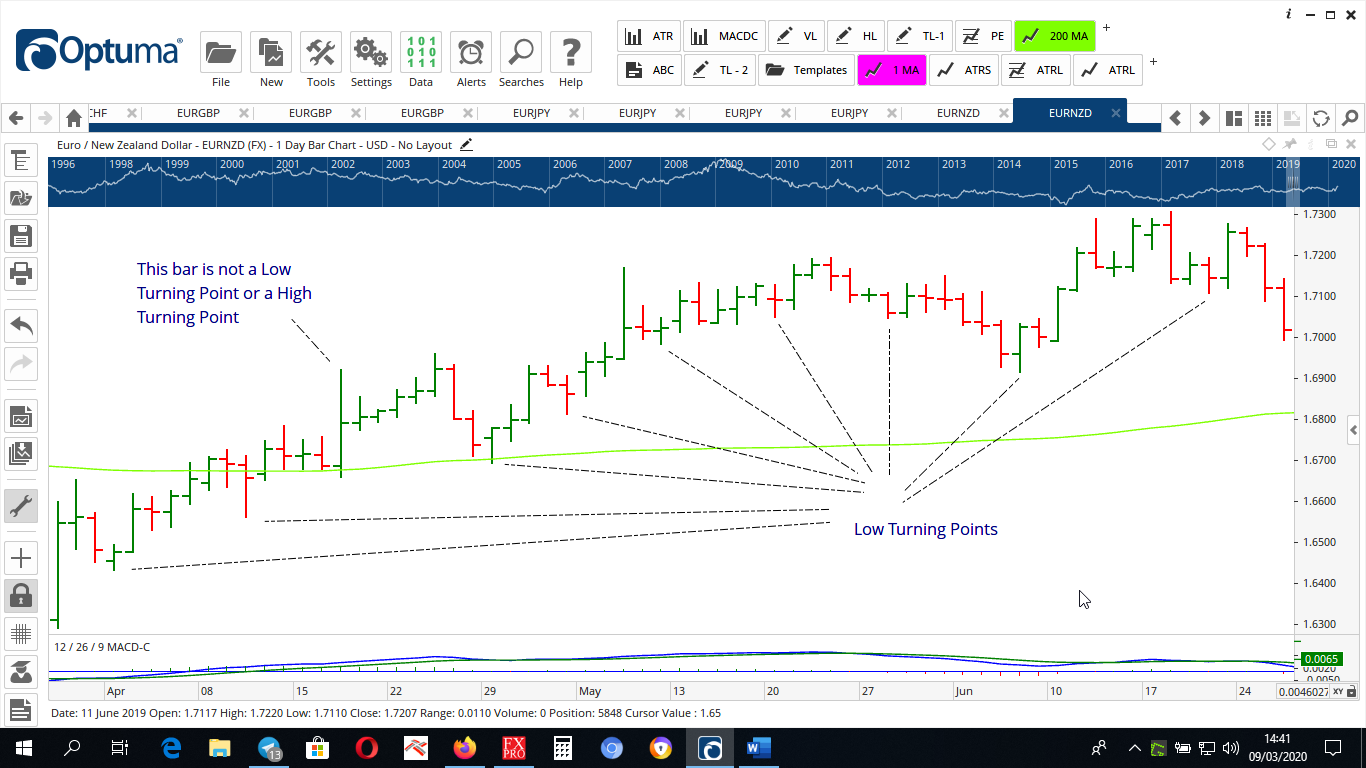
Here we can clearly see 9 Low Turning Points as part of the overall Trend for EURNZD D1
We can also see the overall trend is a compilation of 2 or 3 minor Trends.
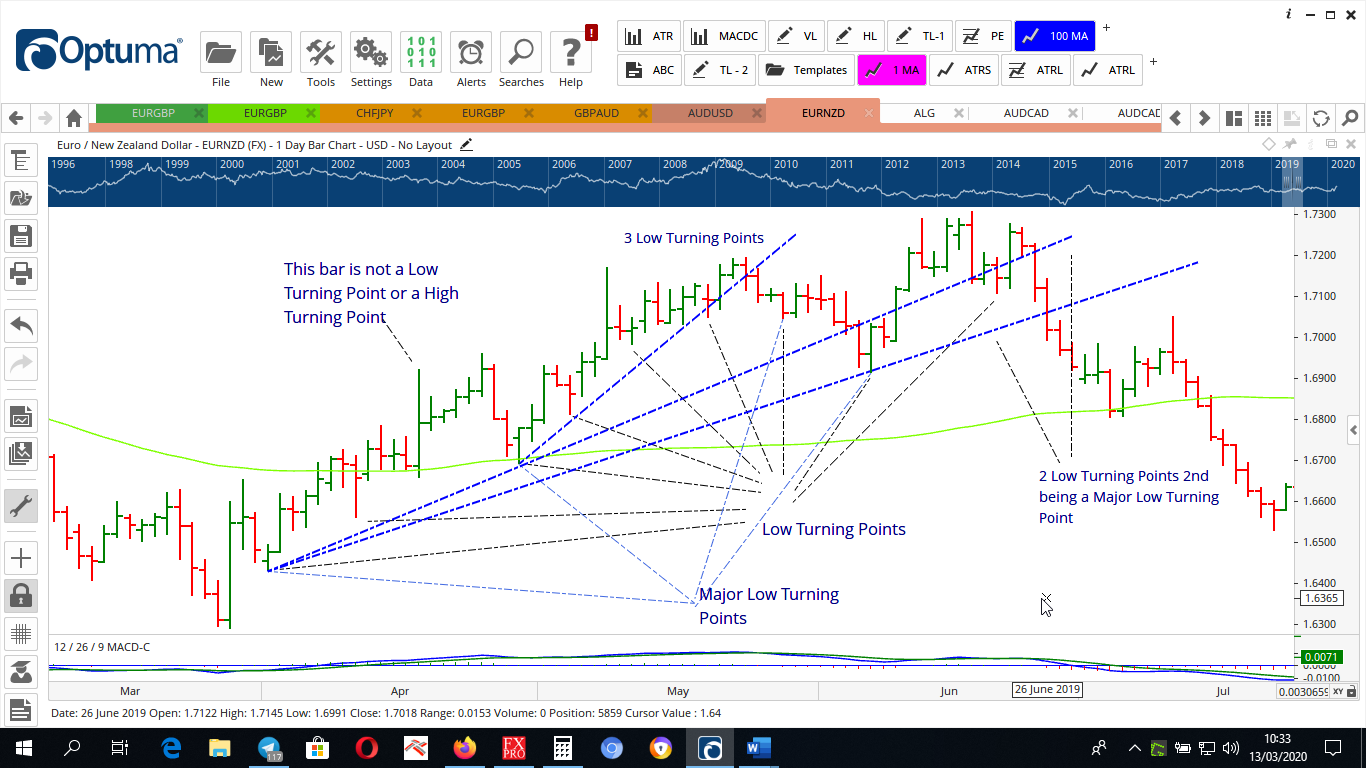
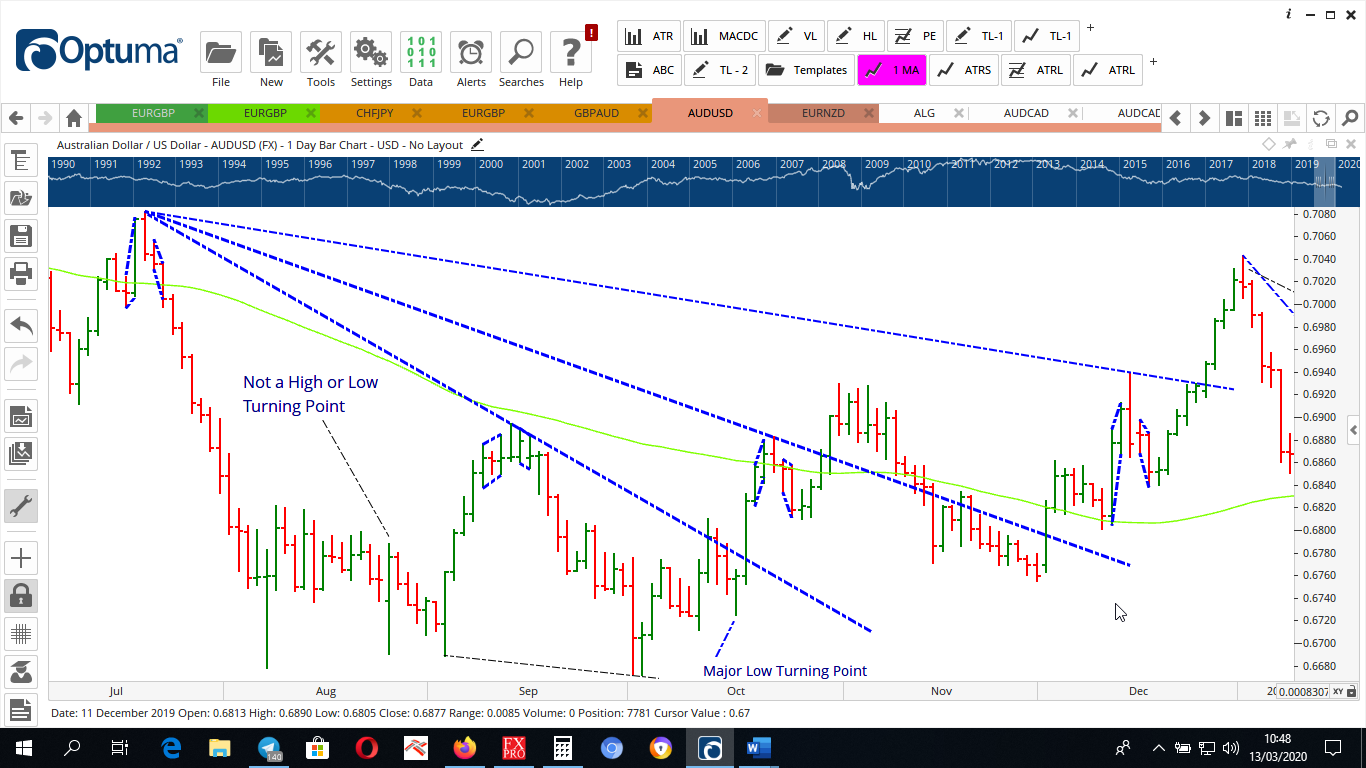
Here we see 3 distinct Rising Trends as a part of the overall Rising Trend.
The 2 longer Rising Trend Lines are applied to the Low Turning Point and then to a Major Low Turing Point.
The steeper of the 3 Rising Trend Lines is applied across 3 Low Turning Points.
It also needs to be remembered that the Higher High & Higher Low / Lower High & Lower Low confirmation of a Turning Point does not have to be the immediate bar / candle on either side of the Turning Point, in the case of inside bars or two short bars next to the Turning Pont, we can legitimately go out to the 3rd bar / candle. After that it has been observed that the reliability drops quite a lot.
Major High / Low Turning Points
Major / Pivot Turning Points are determined by the price action immediately around them.
Major / Pivot Turning Points do carry more significance because of the extra confirmation of requiring:
2 Higher High & Higher Low Bars / Candles running into the Major / Pivot and 2 Lower High & Lower low Bars / Candles running out from the Major / Pivot Bar / Candle for a Major / Pivot High Turning Point.
2 Lower High & Lower Low Bars / Candles running into the Major / Pivot and 2 Higher High & Higher low Bars / Candles running out from the Major / Pivot Bar / Candle for a Major / Pivot Low Turning Point.
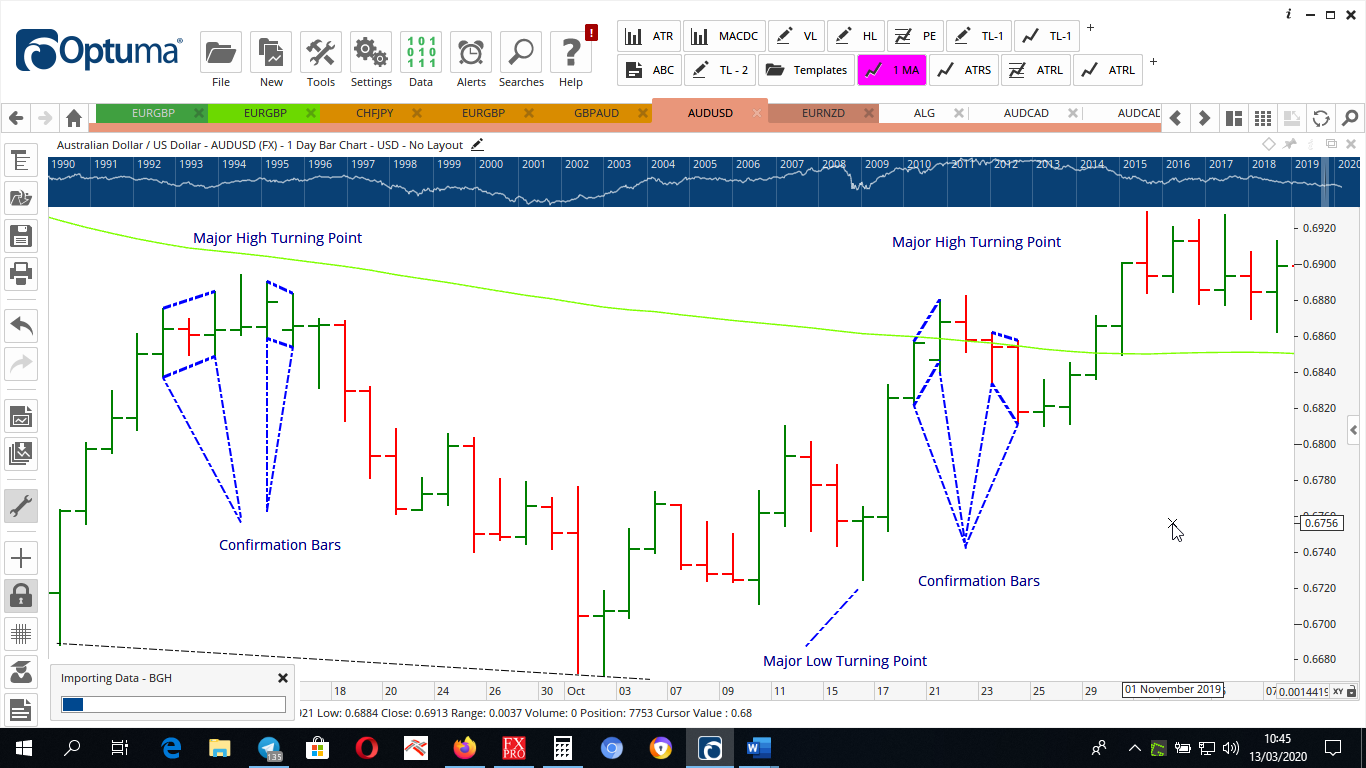
Here we can easily see the Major Turning Points with the 2 confirmation Bars on each side of the Turning Point.

Here we can see 4 Major / Pivot High Turning Points on AUDUSD D1
We can see the 3 Trend Lines applicable for this overall Price action.
For a Major Low Turning Point – a Low Turning point has 2 bars with lower highs and lower lows running into it and 2 higher highs and higher lows running out of it.

Here we can see with the run of 8 Low Turning Points for EURNZD D1, 4 of these Low Turning Points are Major / Pivot Low Turning Points.

Here we see a bar which is neither a High Turning Point nor a Low Turning Point. It has a higher high and a lower low than the bars around it.
We can clearly see it does not fit the definitions of Higher High and Higher Low than the bars / candles on either side or Lower High and Lower Low than the bars on either side.
This bar has a higher high and a lower low than the bars on either side of it therefore is neither and is best to ignore in Trend Line applications.
Conclusion
Accurate definitions of High Turning Points, Low Turning Points, Major High Turning Points and Major Low Turning Points is an integral part of the accurate placement of Trendlines, which in turn is an integral part of increasing probabilities of successful trading.
The ability to eliminate non accurate Trendline Placement is also an integral part of successful trading as it assists in reducing the number of losing trades in addition to increasing the number of successful trades – both of which makes us more profitable.
Hi Logan, Thank you we are happy it was beneficial for you